THINK. PLAN. DO: POLICY, PLANNING + COMMUNICATIONS
  • Home
  • About
  • Services
  • Portfolio
  • Contact

Updates re state exchanges and health disparities

5/17/2020

0 Comments

 
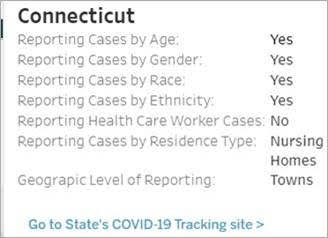
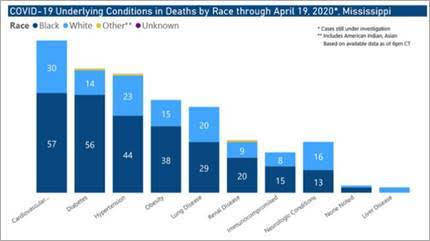
COVID-19 Health Equity Data:  Race, ethnicity, age, gender and location data is needed to understand how COVID-19 is affecting our more vulnerable populations.

In April, the Centers for Disease Control and Prevention started releasing nationwide data showing the race and ethnicity characteristics of COVID-19 cases, although race data was missing in 76% of cases. All states are now reporting some COVID-19 data, but the type and specificity of information that is collected varies considerably across states. 
​Connecticut reports COVID-19 data by age, gender, race, ethnicity, at the town level and at nursing homes, but not at the zip code level or for health care workers. Just 12 states are reporting by race, ethnicity and zip code or census tract level. Currently, only Mississippi reports deaths broken down by both underlying conditions and race.   See State Health and Value Strategies maps for more. 

Connecticut’s own Health Equity Solutions was featured in last week’s national SHSV webinar on tracking and taking action to address health disparities.  Slides here;  recording here.  Health Equity Solutions has also published an article on Five Key Questions State Health Officials Can Ask Right Now to Advance Health Equity During COVID-19 Response Efforts and released the analysis of its recent survey and outreach effort to collect information about the impact of COVID-19 and measures to control its spread on underserved communities.   

UConn’s Health Disparities Institute is holding a Facebook Live conversation on racial profiling on Wednesday, May 13 at 3 PM with nationally renowned scholar activists, researchers, and policy advisors.  ​

DYK?  Maryland Health Connection has an online Household Income Calculator to help applicants determine their Modified Adjusted Gross Income for the year in which they seek health coverage.  ​

How did other states do with their COVID-19 emergency enrollment periods?
  • MNSure: 9,482 Minnesotans enrolled during that state’s 30-day emergency special enrollment period, which ran from March 23 through April 21. More than 13,700 more people applied for public health insurance during that time.
  • Covered California:  as of late April more than 84,000 people enrolled since the beginning of California’s emergency SEP, more than 2.5 times the level of enrollment during the same period in 2019. California’s emergency SEP runs until June 30.
  • Maryland Health Connection:  more than 19,000 Marylanders enrolled during that state’s COVID-19 SEP.  About 60% are Medicaid enrollees and 40% QHP enrollees.  Another 2,500 enrolled through the state’s easy enrollment health insurance program, which is coordinated with Maryland’s tax department. Maryland’s emergency SEP runs until June 15 and its easy enrollment program runs until July 15. 
  • Washington HealthPlanFinder:  As of Apr 23, over 16,000 people newly enrolled.  Of those, 6,000 were previously uninsured, and 10,000 enrolled through a qualifying life event.   Washington’s emergency SEP ended May 8 after being extended by 30 days.
  • Connect for Health Colorado estimated about 10,600 people had signed up for coverage with 8 days to go during its emergency SEP, which ended April 30.  Typically, only about 1,000 people sign up each month outside open enrollment. 
  • Mass Health Connector:   20,000 new enrollees have gotten covered since March.  Additionally, 11,600 Health Connector members now qualify for the state’s Medicaid program. 12,000 more people reported a change in income and have switched insurance plans — a notable high for the season. 

How will COVID-19 impact insurers? A recent Wakely Consulting study says COVID-19 could cost US insurers anywhere between $56 billion to $556 billion through the next year.  This report comes when health insurers are working on plans to determine their rates for the 2021 benefit year.  A different study released in March by actuaries at Covered California estimated the cost of covering testing, treatment, and care for the 170 million Americans in the commercial market anywhere between $34 billion to $251 billion or more in the first year of the pandemic. The Wakely study was commissioned by America’s Health Insurance Plans (AHIP).
0 Comments

Across the Country in ACA World - Oct No. 2

10/14/2019

 
Colorado made big news last week with its draft proposal for a public option.  The proposal is required to be submitted to the CO legislature by Nov. 15. Legislation passed last session required CO’s Division of Insurance and the Department of Health Care Policy and Financing to develop the plan. The public comment period runs through Oct 25.  Under the draft proposal, the State Option would:
  • Be available to all CO residents regardless of eligibility for subsidies, beginning 1/1/2022;
  • Be offered as a Qualified Health Plan through Connect for Health Colorado;
  • Be offered by every carrier in CO over a certain size (tbd), both on and off the Exchange;
  • Boost enrollment by adding 4,600 - 9,200 previously uninsured, unsubsidized people to the individual market, according to Wakely projections.
  • Offer all Essential Health Benefits; include more benefits that are not subject to the deductible, plus other high-value services like dental, pending savings and federal approval;
  • Incorporate value-based design elements;
  • Save money by capping payments to hospitals at 175%- 225% of Medicare rate.  Insurers selling plans on the individual market in the state currently pay providers about 289% of Medicare.  Additionally the State Option will require at least 85 cents of every dollar of premiums to be spent on health care.  That’s more than the current federal requirement of 80 cents of every premium dollar; and
  • By driving premiums down, save the federal government between $69.7M and $133.6M in premium tax credits.
    ​
Where You Live Affects How Long You Live - Check out the amazing new “social determinants of health” tool from the Robert Wood Johnson Foundation. Enter a street address to see life expectancy at the neighborhood, county and state level.  See how much a neighborhood can impact people’s health.

New Jersey is investing $2 million in navigators as it starts the shift from healthcare.gov to its own state-based marketplace.  New Jersey’s state-based exchange is officially barely a month old.

For a highly impressive use of data based on the California Health Information Survey using brainpower from the UCLA Center for Health Policy Research, check out the AskCHIS Neighborhood Edition© web tool. The tool lets you search for top health indicators by ZIP code, city, county, and legislative district (state and federal). The sample below shows the prevalence of diabetes across California (diabetes increases health care costs which increase premiums…).  Of course, the tool is only for California. Connecticut could use its own version. 😊 

Across the Country in ACA World - Oct No. 1

10/8/2019

 
  1. Still waiting!  The 5th Circuit Court of Appeals decision in Texas v. Azar is due any time. This is the case that appeals a federal trial court judge’s decision in Dec 2018  that the individual mandate and the entire ACA are invalid now that the tax penalty for being uninsured was dropped to zero. Currently, 18 states, led by Texas, claim the ACA is unconstitutional. 21 states, led by California, are defending the ACA.  The federal government also now claims the whole ACA is unconstitutional. Previously, the US Supreme Court said that the tax penalty is what made the mandate and the ACA permissible because Congress has the power to tax.  Kaiser Family Foundation explains more.

  2. Healthscore CT’s cost estimator component is now live.  Healthscore CT lets people compare the cost of medical care at Connecticut hospitals and provider networks.  It also has a quality component, with a scorecard for providers. Healthscore CT is a project of CT’s Office of Health Strategy.

  3.  “The ACA at 10” conference at Yale offered excellent perspectives on the ACA’s history, legacy and challenges. Speakers included some of the original architects of the ACA, including Kathleen Sebelius and Rahm Emmanuel, and many of the country’s leading experts on the ACA.  Watch any segment you’re interested in: 9/26 video.  9/27 video. Agenda.

  4. In California:
     - Covered CA and UCLA conducted research on the role of Behavioral Frictions in Health Insurance Marketplace  that was published by the National Bureau of Economics Research.  The study found that reducing “behavioral frictions”--the hassles involved in enrolling--counts for a whole lot in getting people to enroll.  Significantly, the study found that people who put off completing their enrollment tended to be healthier. Having healthier people in the risk pool helps keep premiums lower down the road. Sending a simple reminder letter was the most effective intervention in getting those people to enroll.  The study looked at Medicaid to QHP customers separately from those who visited the exchange on their own initiative. Behavioral Economics Could Increase Obamacare Enrollment and Stabilize Markets.   
     - California also has its own state health insurance survey which policymakers, researchers, health experts, members of the media and others regard as a critical source of comprehensive data on the health of Californians. More here and here. 
     - 
    California’s OE starts early, btw, on Oct 15 and ends Jan 15. 


  5. Colorado:  New results from the Colorado Health Access Survey show that the uninsured rate increased from 9.7% to 11.8% for people who earn two to three times the federal poverty level.  The uninsured rate also increased for people between 50-65, and for kids 18 and under. Overall though, CO’s uninsured rate held steady at 6.5%.

  6. In Minnesota:   
     - MNSure is adding 39 new health plan options for 2020.  Window shopping starts Oct. 15.  
     - MNSure reports that nearly 75 percent of uninsured Minnesotans—over 250,000 people—in 2017 would have been eligible for financial help through MNsure.  How do they know? Because Minnesota conducts a Health Access Survey. 
     - Minnesota also has new interactive data (consisting of a downloadable and interactive Excel spreadsheet tool, and an interactive Minnesota map) on its uninsured population at the zip-code level. Partnering with the Blue Cross Blue Shield Foundation of MN, who provided project funding, and with essential guidance from the MNsure advisory board, this resource is useful for the exchange and policymakers as they develop strategies to reach the remaining uninsured in Minnesota.

  7. Data:  What new things should CT be doing with data to stay ahead of the curve? Where can we collaborate? Data lovers might want to attend the free CTData conference Wednesday, November 20 in New Haven.  Register. 
<<Previous

    RSS Feed

    categories

    All
    ACA
    Health Disparities
    State Based Exchanges
    Texas V US

    archives

    May 2020
    April 2020
    December 2019
    October 2019
    September 2019
    August 2019

Think. Plan. Do:  Kelly Kennedy Consulting  © 2004-2025
West Hartford, CT  |   [email protected]  |  
www.think-plan-do.net
  • Home
  • About
  • Services
  • Portfolio
  • Contact